


Research Question:
How do heart rate zone values differ during a 1-mile run when comparing popular wearable devices such as the Apple Watch, Polar H10, and Whoop?
Summary
After completing my previous research comparing sleep metrics, I knew I wanted to take on another challenge and compare heart rate data. Rather than walking as I did during my previous study back in 2022, I decided to take it up a notch and try running. Additionally, given the increase in popularity of what is known as "Zone 2" training, I thought that comparing heart rate zones across devices would be the perfect challenge to tackle next.
It should be of note that the Apple Watch Series 8 was worn on my left wrist, the Polar H10 chest strap was worn around my ribs at the xiphoid process, and the Whoop 4.0 was worn on my right wrist. The treadmill I was using for this study was a Precor branded treadmill at my local gym. Throughout the study, I wore Hoka Clifton 7 running shoes, shorts, and a hoodie to keep the apparel the same.
In regard to the process itself, I began a warm up walk at 3.5 mph, and every minute for 5 minutes, I would increase the speed by 0.1 mph prior to the 1-mile run. Once the 5 minute warm up was complete, I would immediately increase the speed to 6.5 mph (9:13 minute pace) and run for 1 mile which was tracked by the distance provided on the treadmill. The moment the treadmill stated that I ran for 1 mile, I would decrease the speed to 3.0 mph and begin walking again as a cool down from the run. Similarly to the warm up, I would decrease the speed by 0.1 mph every minute until 5 minutes had passed for this portion of the task. Lastly, once the 5 minute cool down was complete, I would stop the heart rate tracking on each device.
Without fail, every time I complete these studies, I seem to have some sort of technical difficulties that must be mentioned. The first of the difficulties is that on the first day, February 3rd, the treadmill I was on simply stopped as I was halfway through the run. I moved to the treadmill directly next to it and started exactly where it had stopped. Next, on February 8th, I was out of town and did not want to complete the run on a different treadmill, hence the lack of data on that day. Finally, on February 9th, given that I was wearing a hoodie throughout this study and the Apple Watch is touchscreen, it somehow ended my run before the warm up finished. Thankfully, Apple sends haptic feedback when it looks like you are working out so I was able to salvage some of the data by clicking "begin indoor run" as I was about to begin the running portion of the study.
Despite the challenges faced throughout this experiment, I thoroughly enjoyed having the opportunity to complete another comparison study. I love the process of collecting data, especially as it involves working out and moving my body. Ultimately, each study makes me more excited for what's to come next and I can't wait to see what is on the horizon. Without further ado, below is the data as a result of this comparison study.
Comparison of Heart Rate Zone Metrics
Comparing Totals
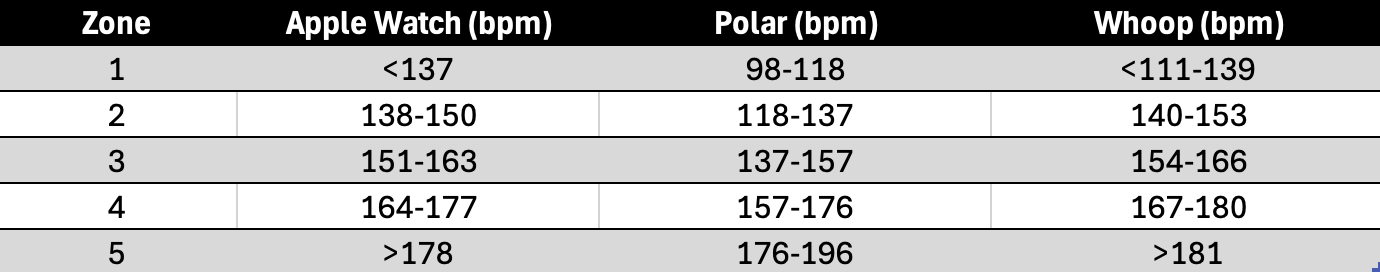
The table shown is a standardized version of how each device measures its respective zones. It should be of note that Whoop measures heart rate zones from Zone 0 - 5 unlike the Apple Watch and Polar which measure from Zone 1 - 5. In order to standardize the zones, I have added Whoop's Zone 0 and 1 as the combined range is relatively similar to the other two devices' range in beats per minute.
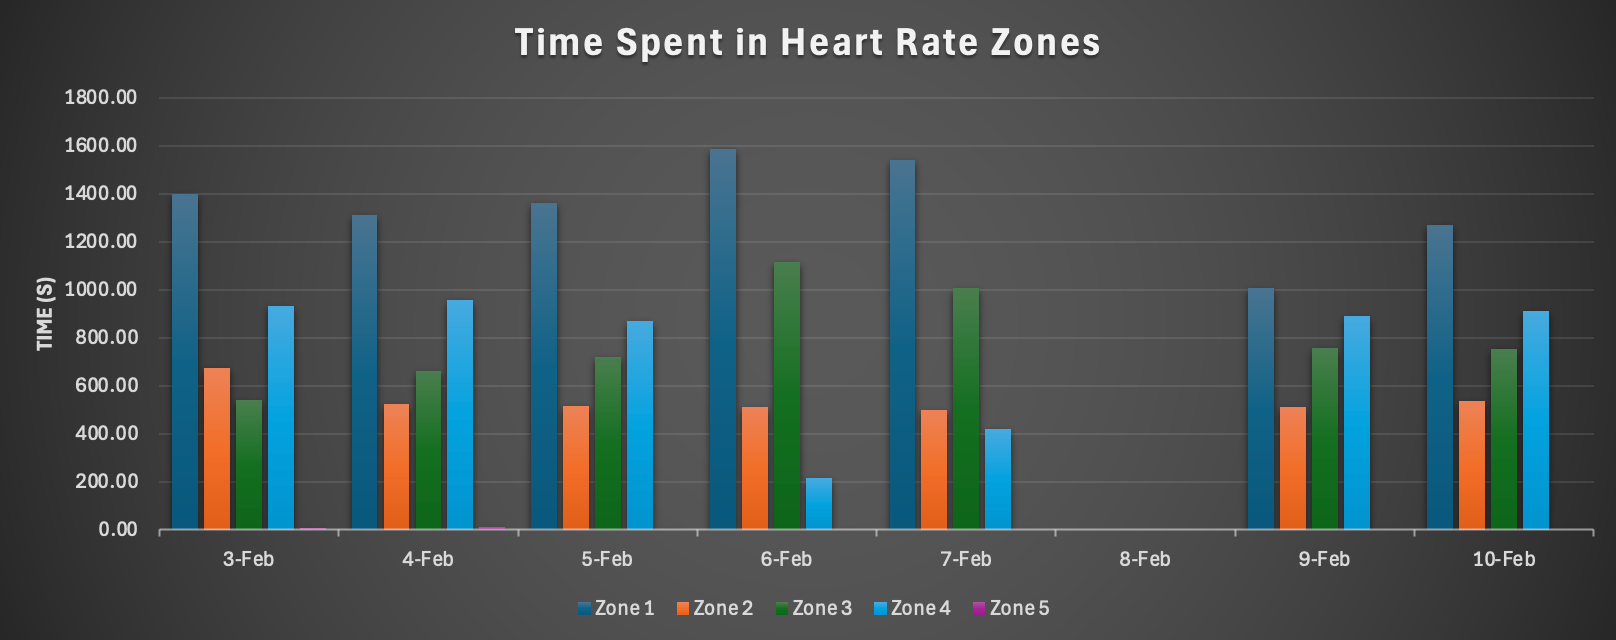
The clustered column chart serves as a visual representation of the table described below. As you can see, there is was far more time spent in Zone 1 compared to the other zones, likely for two reasons. The first reason is that the pace for the mile was not an all out pace by any means as it was only a 9:13 pace. Second, Whoop's Zone 0 and Zone 1 times were combined which could be the reason why the times were longer in that zone.
The table shown is the sum of the time spent in each zone across all three devices. Each device recorded the time spent in each zone by minutes and seconds so in order to standardize the time, I converted everything to seconds. I added the time from all three devices to show the total time spent in that zone on that day.

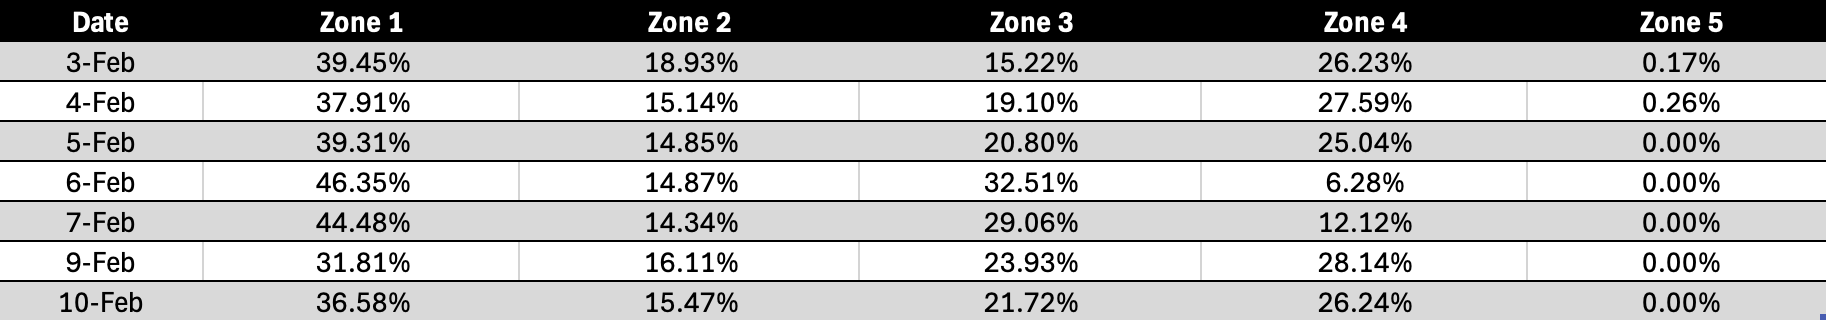
The table shown is the the percent of time spent in each zone when the total time of the devices is combined. Below, you can see pie charts showing the differences between the percentage of time spent in each zone on each day respectively.
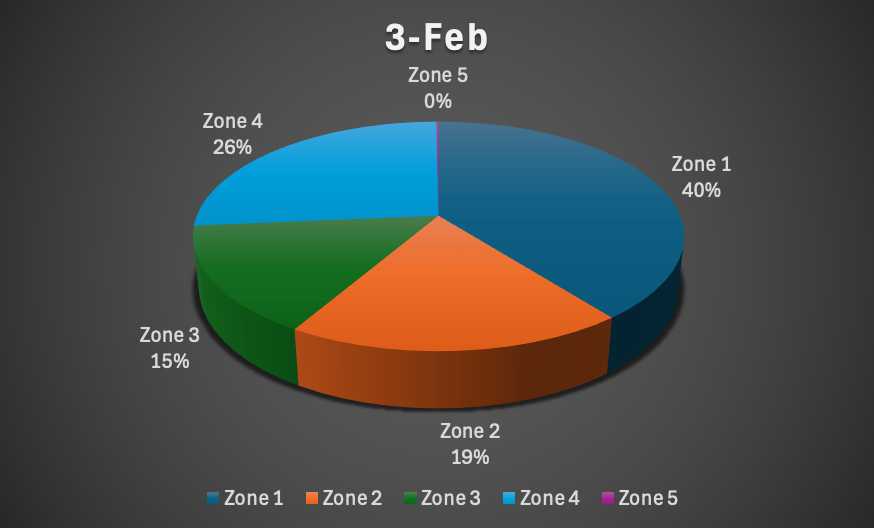
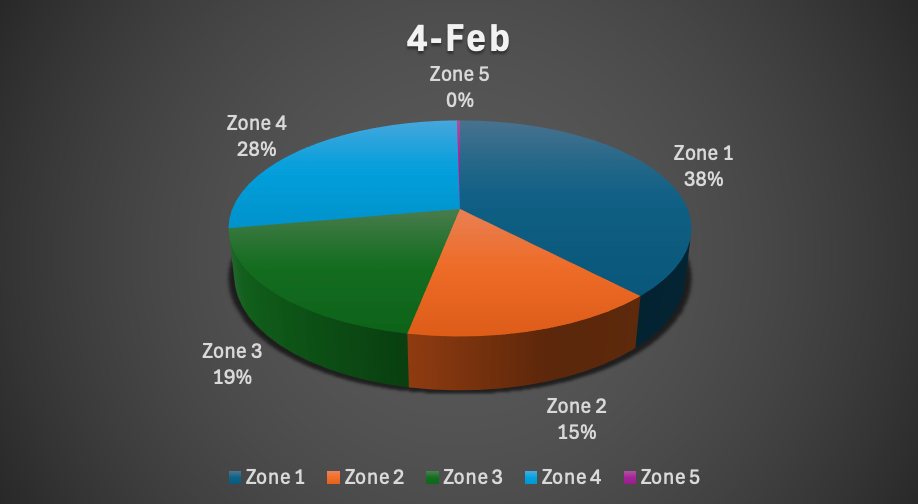
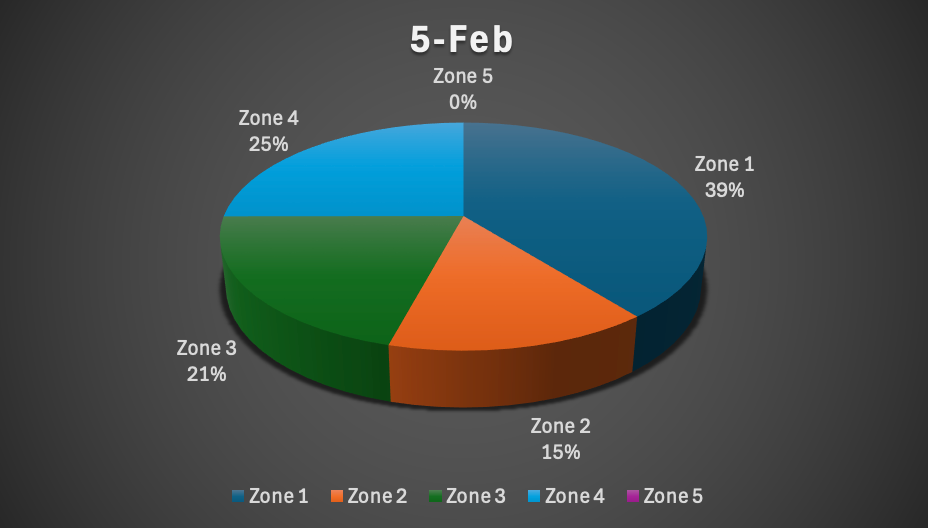
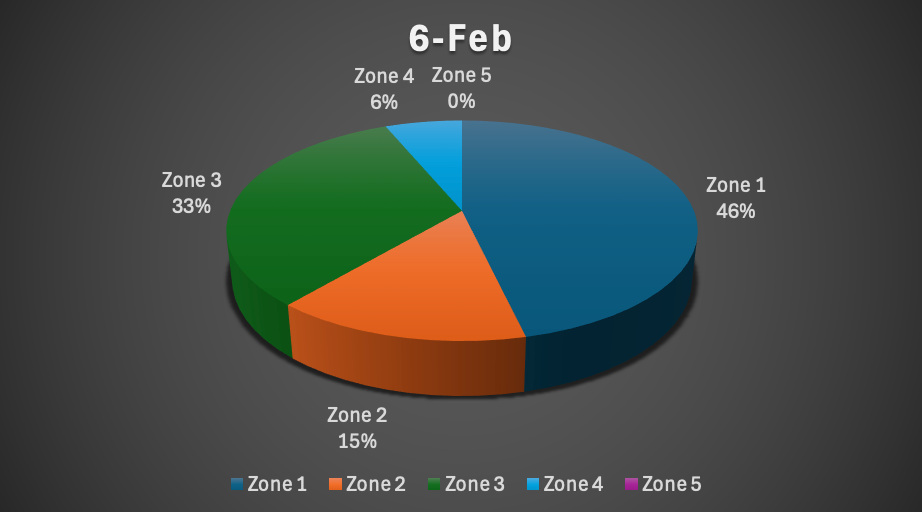
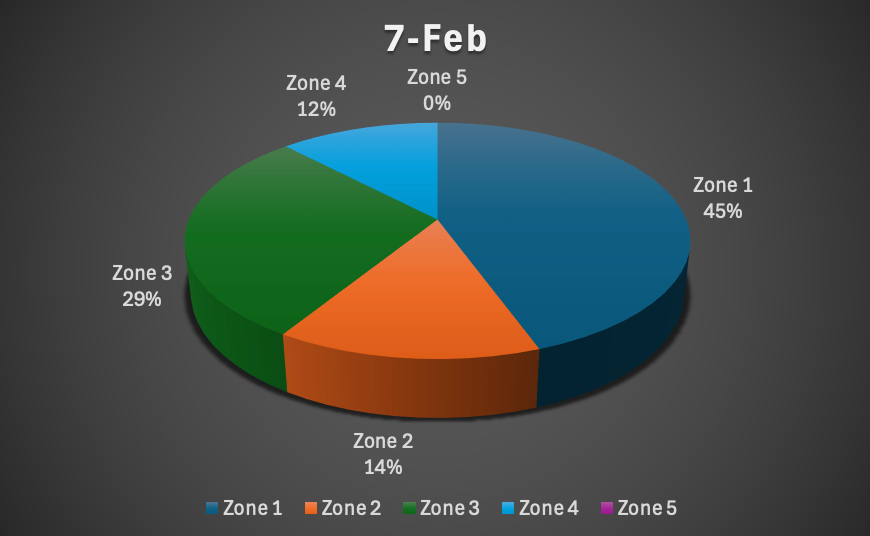
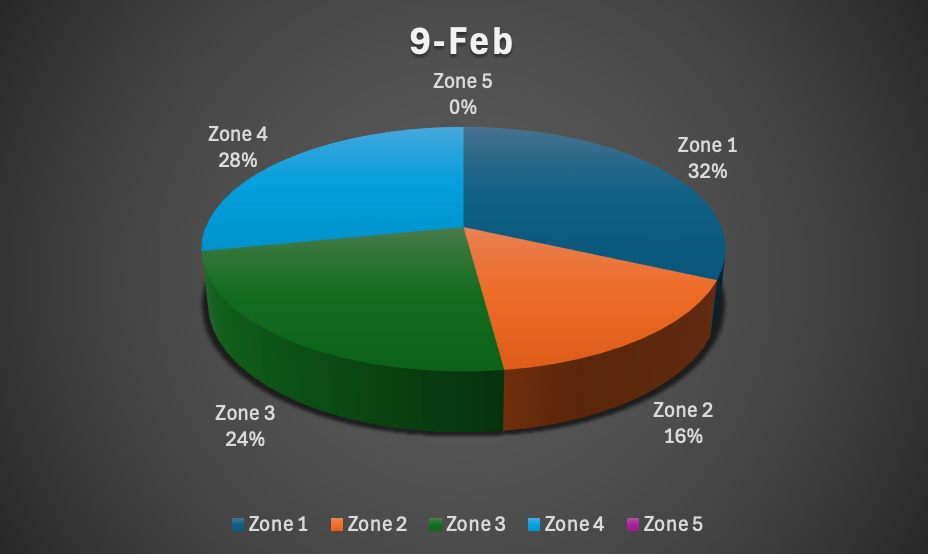
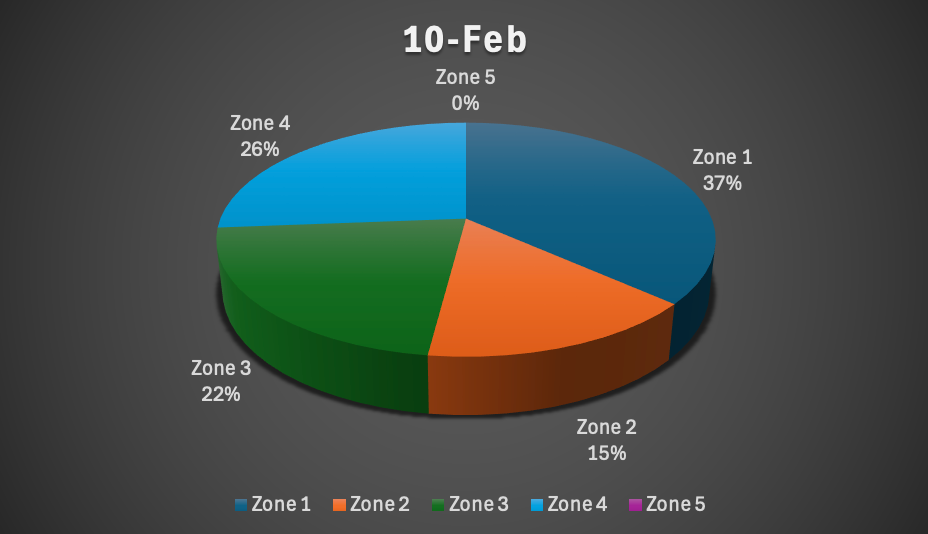
Given that the pace during the 1-mile run for this study was not very fast, it is clear that the percentage of time spent in zones with slower heart rates could superceed that of the other zones. It is interesting, though, that subjectively, I felt as though I was in a rate of perceived exertion range of 4, or what felt like Zone 2, yet the total percentage spent in Zone 2 across the 7 days was less than Zones 1 and 3. Despite this, you can see that the percentage of time spent in each zone across all devices was relatively similar each day. When looking at the percentage of time spent in each zone from a holistic lens, it is evident that you should be cautious as to whether or not to follow the device's zone recommendation during training. I think that wearable devices could serve as a great guide, but it is imperative that you look at the device's heart rate range recommendation and compare it to your actual Zone 2 range. An easy way to figure out your heart rate Zone 2 range is doing: Max HR - resting HR then take 70% of that + resting HR. While this formula is convenient, I think the easiest way to determine if you have exceeded Zone 2 is if you fail the talk test, which simply means you cannot hold a conversation at a comfortable level while exercising.
Comparing Devices Amongst One Another
Below are the clustered bar charts looking at the time spent in each zone compared across all three devices for each day.
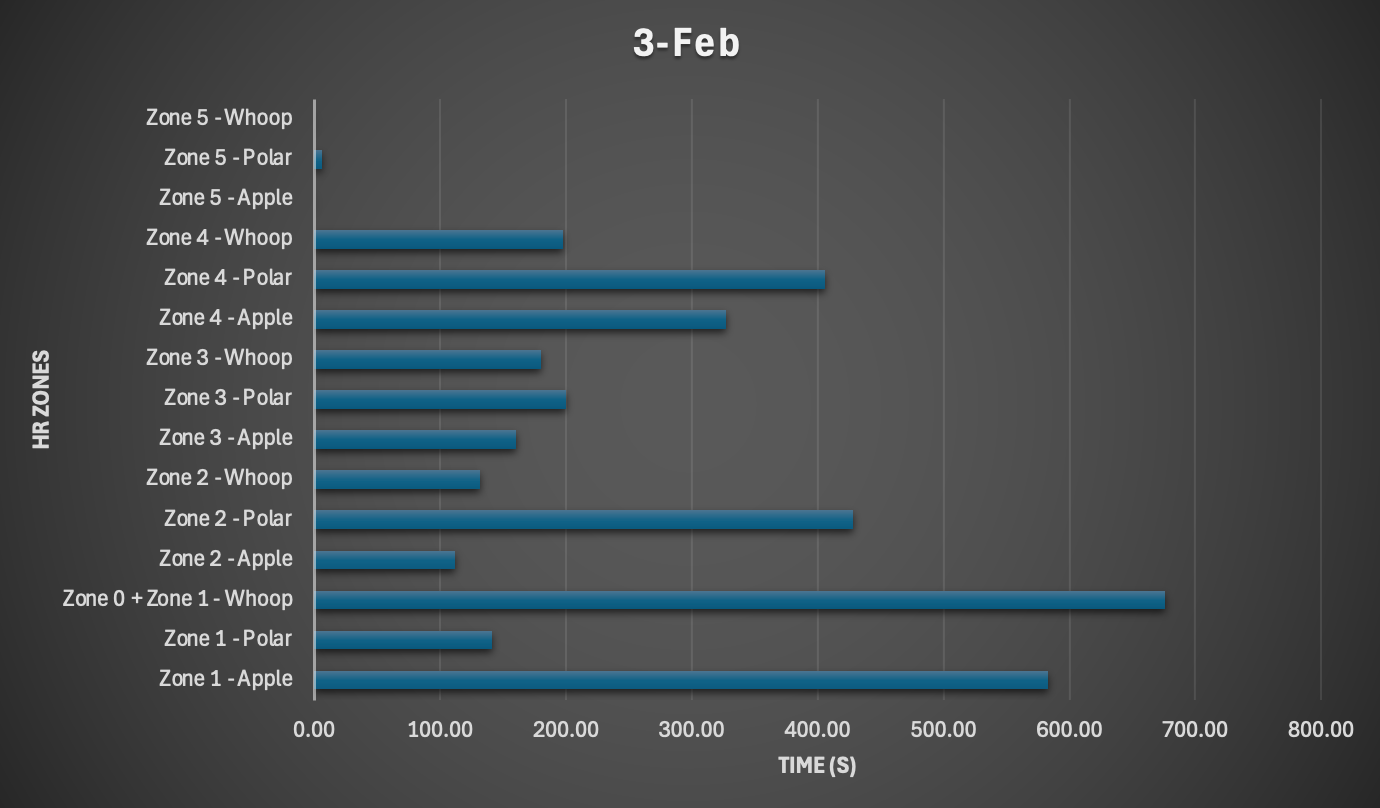
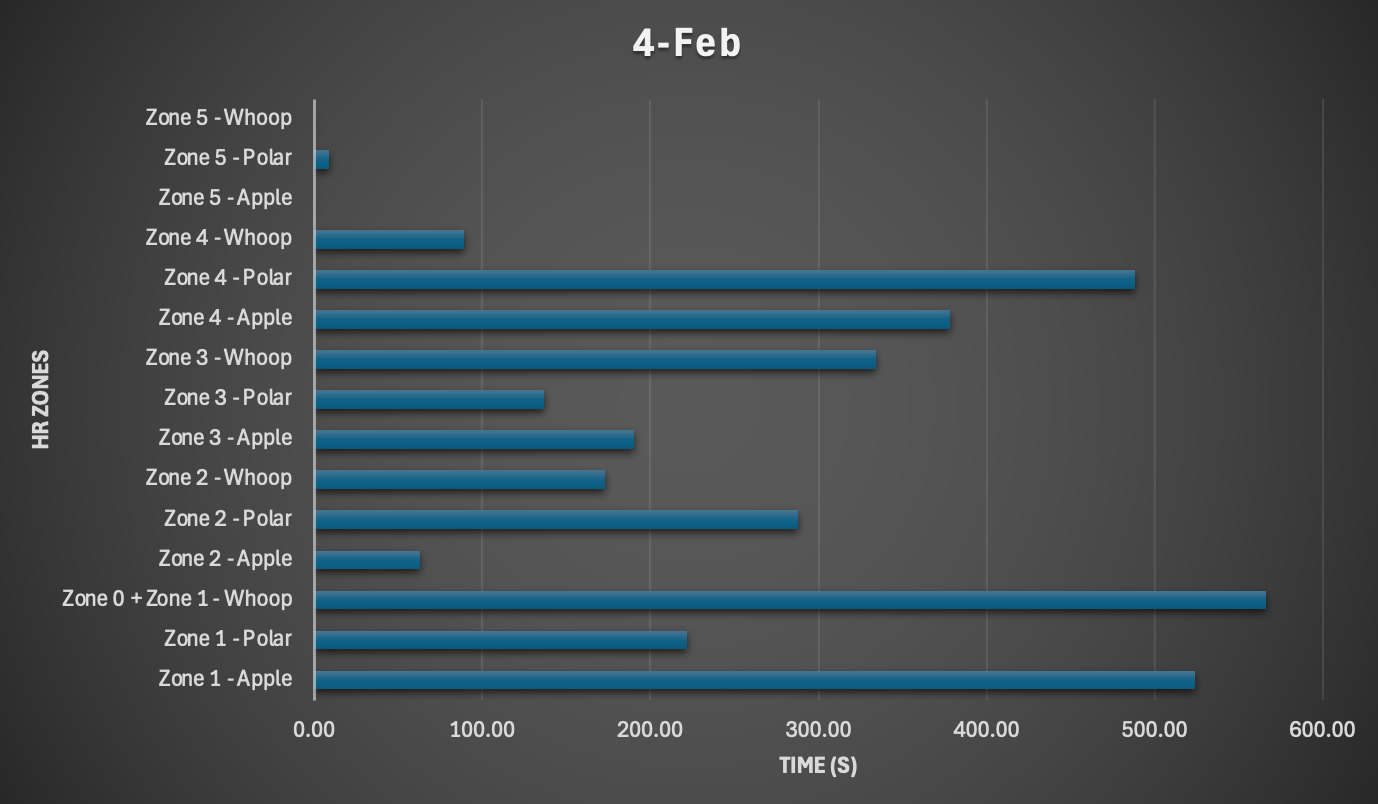
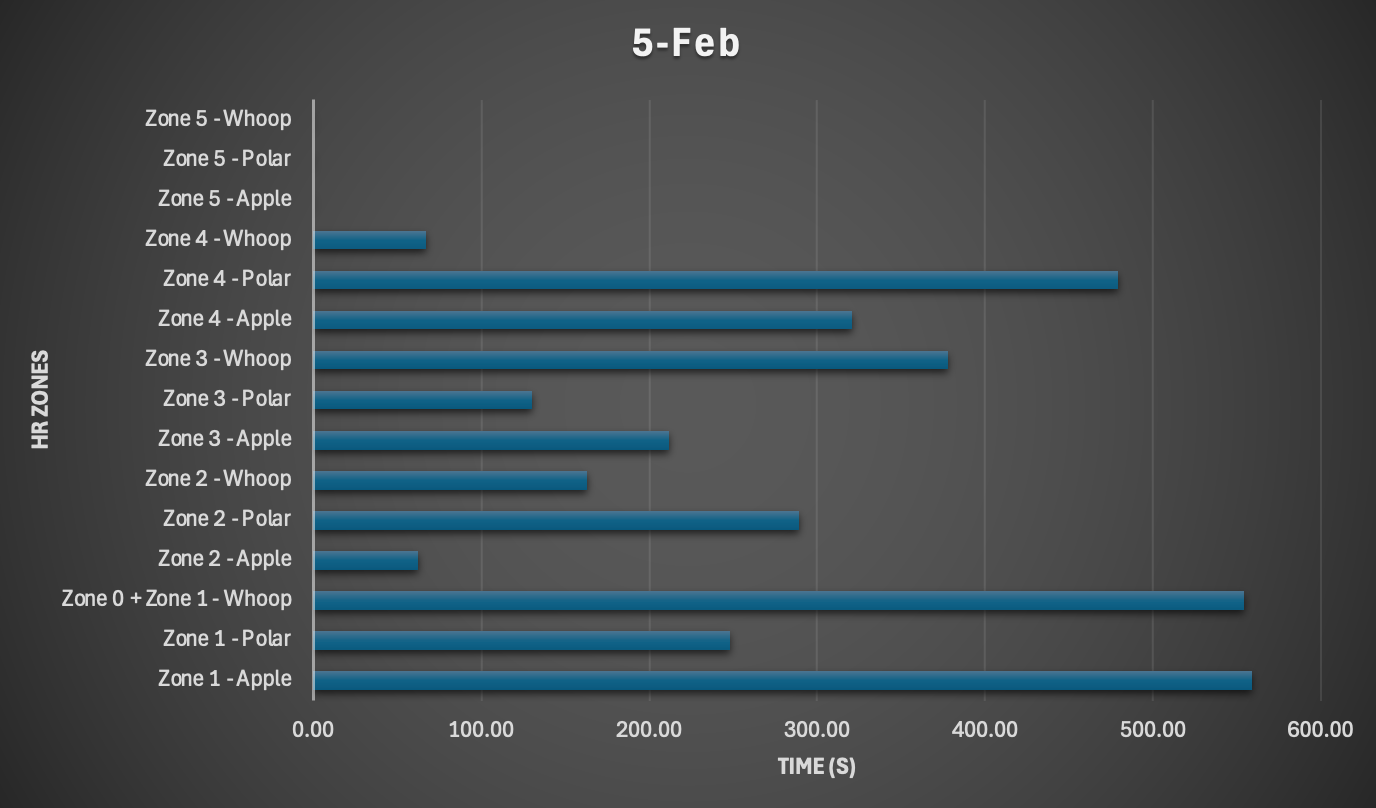
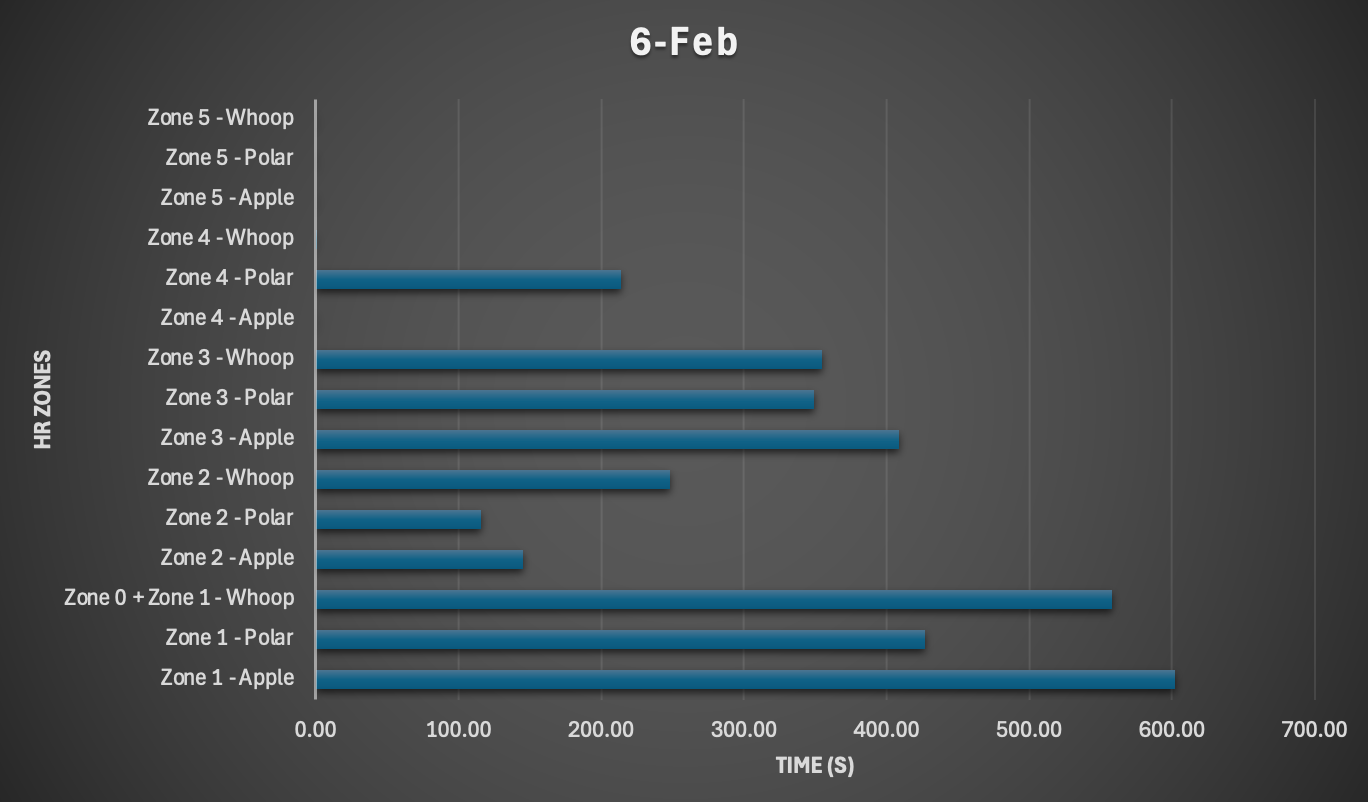
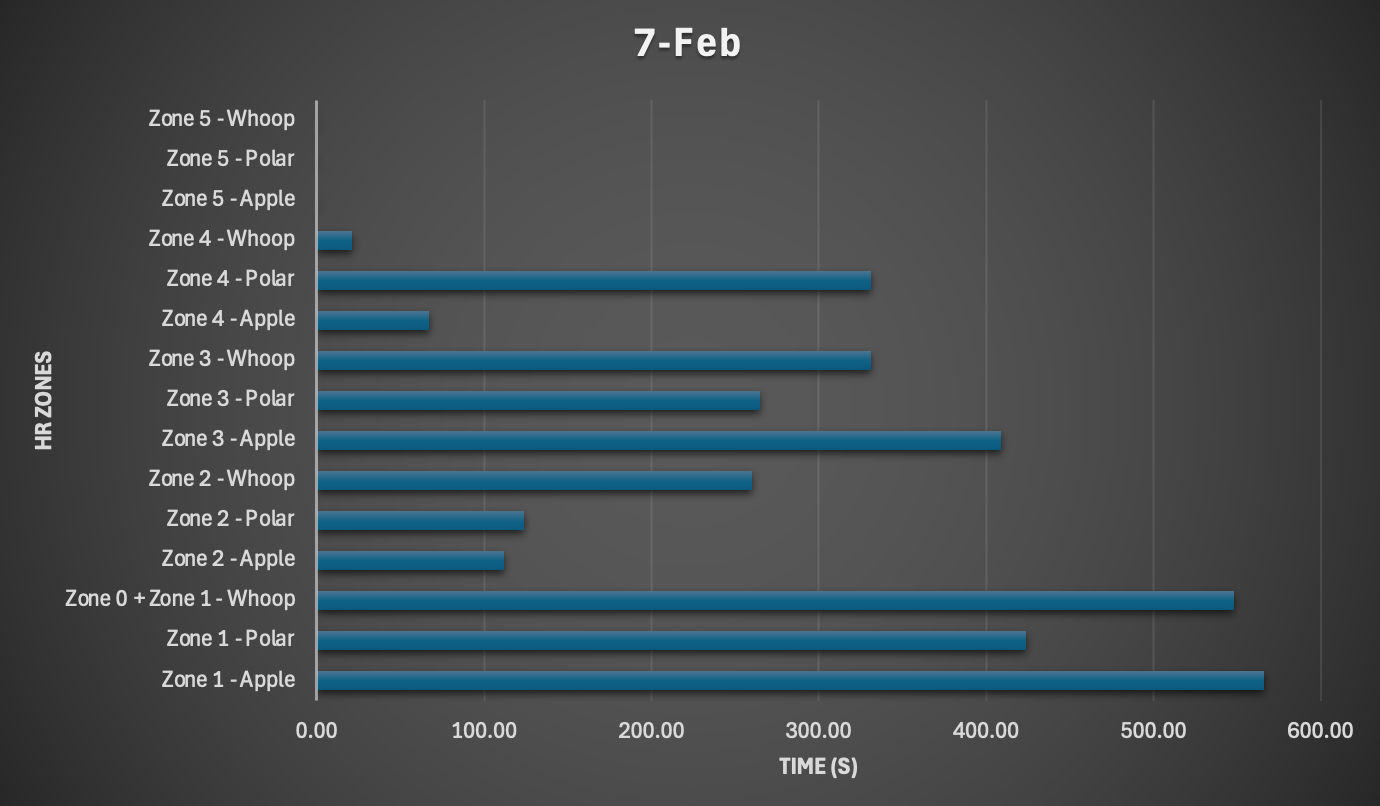
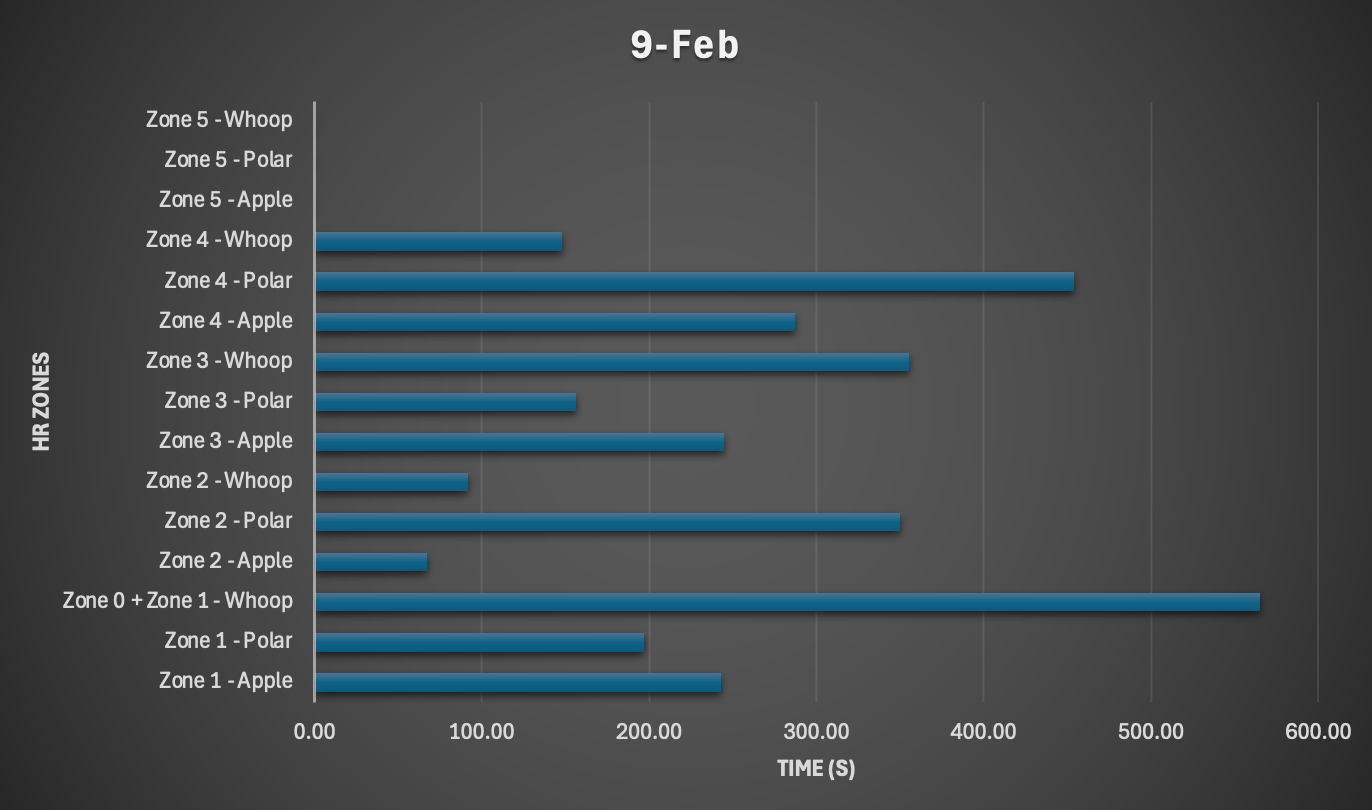
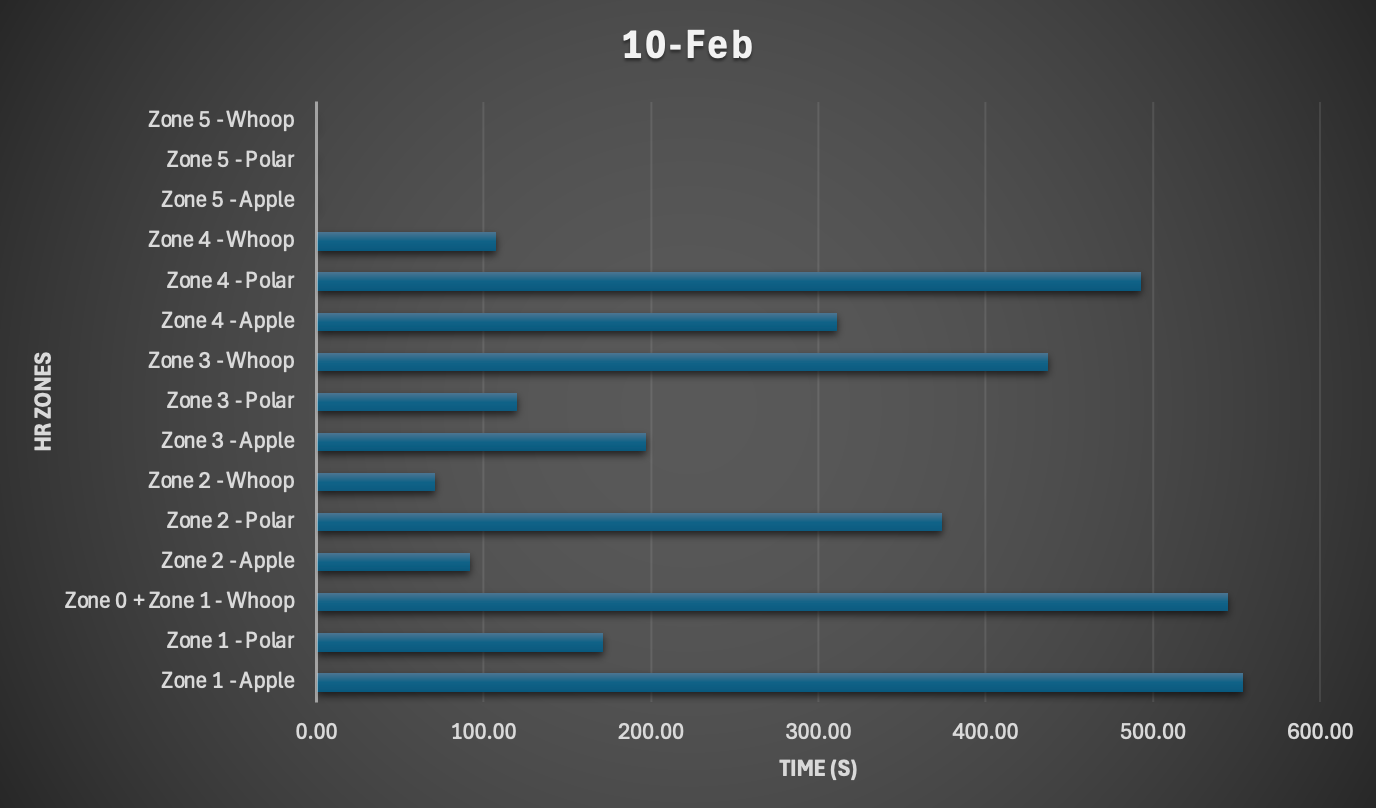
As we know, each device has its own heart rate range, hence the numerous differences seen across each heart rate zone and each respective day. With that being said, by simple visual representation, you can see that Zone 1 for both Apple and Whoop were very similar across each day. Polar seems to estimate more time spent in Zone 2 across each day compared to the other two devices. For the most part, each device seems to believe that I spent similar amounts of time in Zone 3, which is fairly interesting. As we move into Zone 4, this is another area in which Polar believes I spent more time in this zone compared to the other devices. Then, in regard to Zone 5, only Polar stated that I reached a high enough heart rate to achieve this zone during the first two days of the study, whereas Apple and Whoop never thought my heart rate exceeded Zone 4.
So what does this mean?
The fact that all three devices agree on the time spent in Zone 1 suggests that this is an area where heart rate measurements are quite consistent across these devices. Since Zone 1 is very light, it may be more accurately measured due to the low intensity of activity and relatively stable heart rate readings. Given that Polar reports more time in Zone 2 compared to the other devices, this may suggest that it has a lower threshold heart rate range, which can be seen in the initial table when looking at the different heart rate zones across all devices. The fact that all three devices generally agree on time spent in Zone 3 indicates that the heart rate thresholds for Zone 3 seem to align well across devices and is a more defined range. Given that Polar estimated more time spent in both Zones 4 and 5 compared to the other devices, this suggests that the heart rate threshold for reaching higher intensities is lower than the other devices, which can be seen in the HR Zone Range table, or that it has a different sensitivity to increases in heart rate. If the latter is the case, that would mean that someone should use the Polar chest strap when attempting to train toward their maximum heart rate.
Below are clustered column charts that show the absolute value of the percent difference between each device.
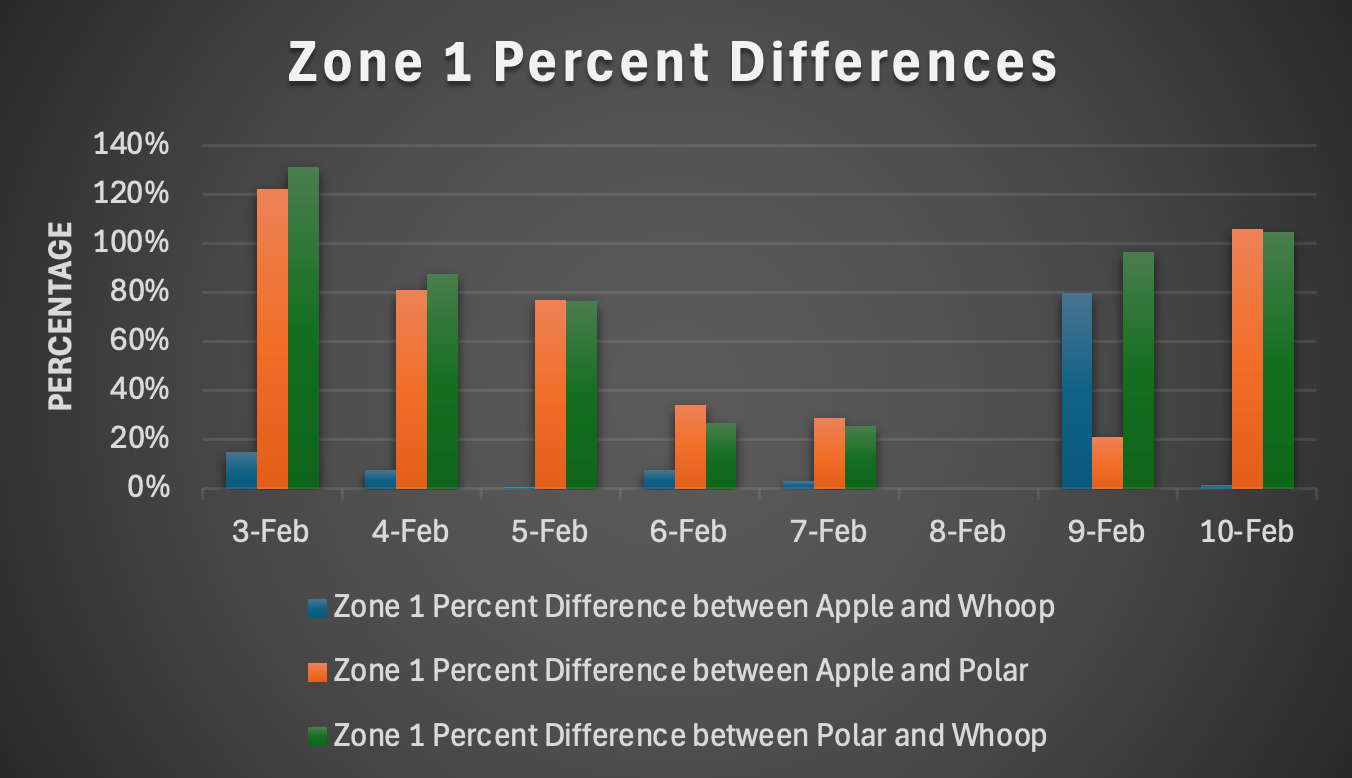
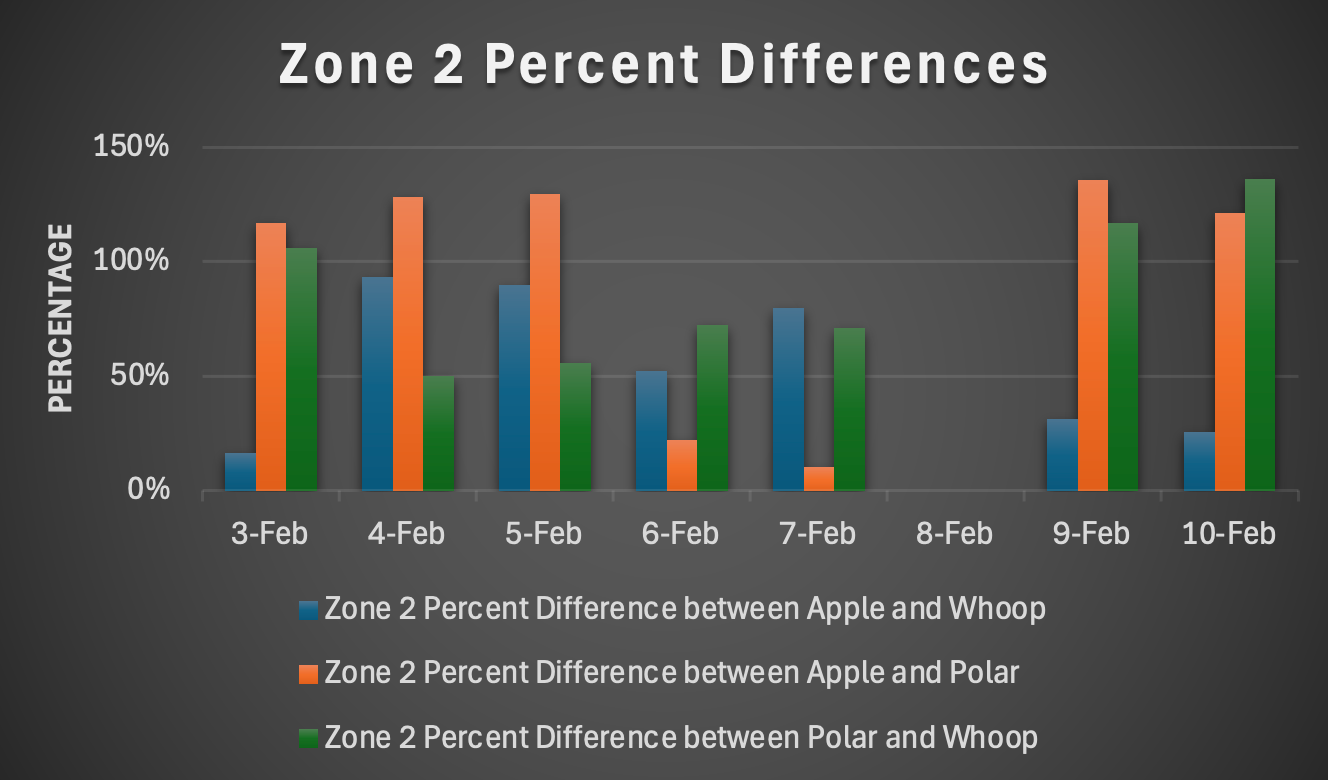
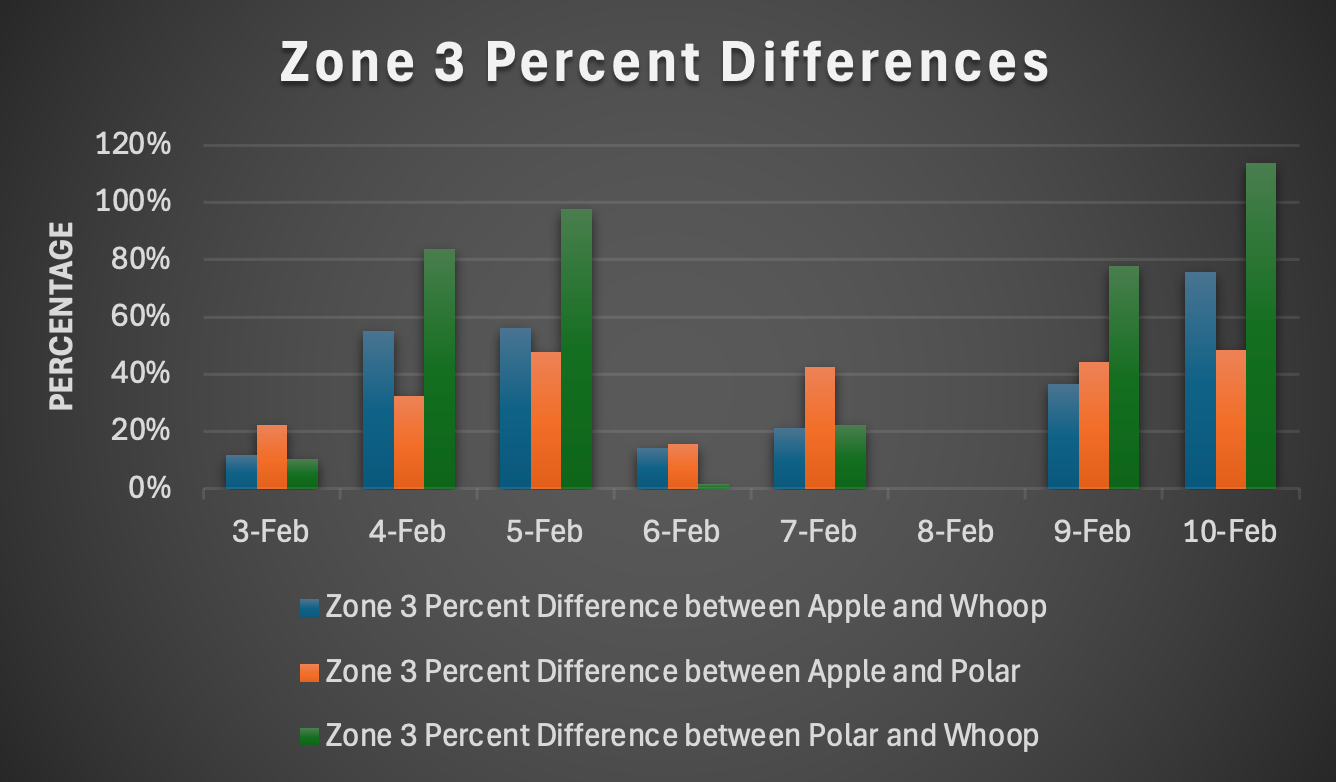
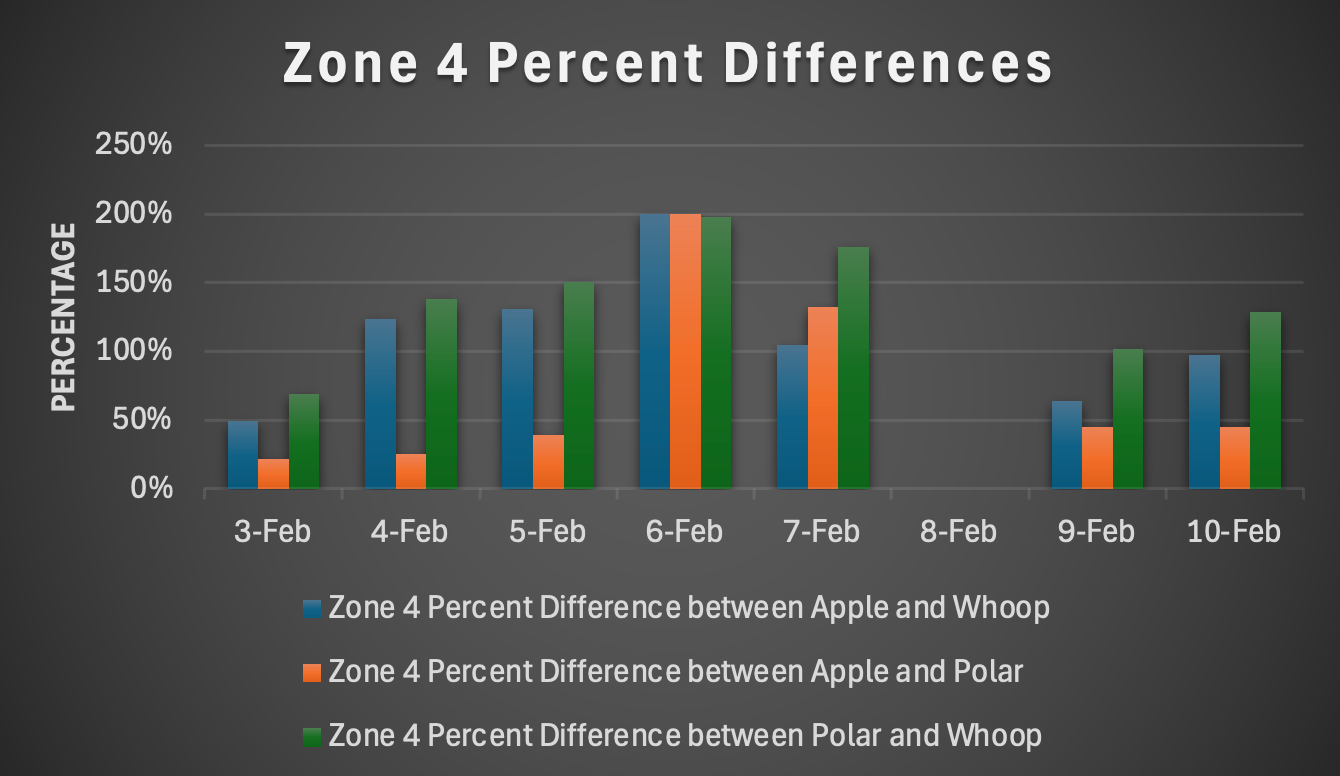
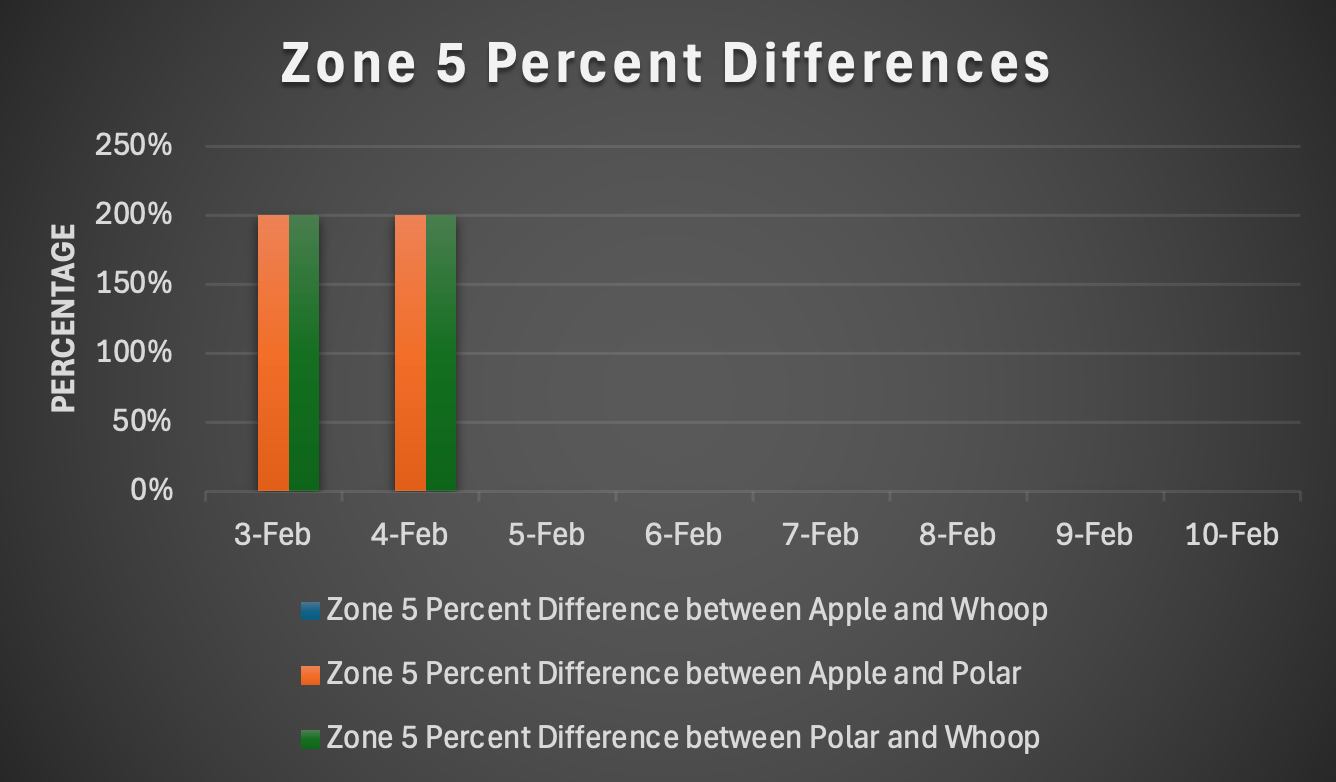
The rationale behind choosing to look at the absolute value of the percent differences when comparing each device to one another is that I simply wanted to look at the magnitude of difference between them rather than stating that a device was overestimating or underestimating. However, you can see that the magnitude of the percent difference varies across each heart rate zone and the day that the activity was performed. I found this quite interesting as most of the experiments were completed in the same way without technical difficulties. As you can see, it seems as though Zone 1 data across Apple and Whoop have the least percent difference between the devices across the entirety of the study. However, as the heart rate increases and we start looking at Zones 3 and 4, it seems like there is a shift in which the percent difference between Apple and Polar is the lowest. Across the board, it seems as though Polar and Whoop have the highest percent differences, no matter which zone you look at. These differences could be attributed to the difference between reference zones that each platform uses. I think that it is safe to say that looking at the percent differences does not determine which wearable device is better, but it does give insight as to whether or not you should compare devices or if you should stick to looking at the trend of one device.
Final Thoughts
With Zone 2 training being all the rage, especially in regard to this new trend of hybrid athletes, I had to see for myself what all the hype was about. It was clear that I needed to put my wearable devices to the test and compare what they had to say when it came to training. I went into this study without realizing that each device had a different range of beats per minute that they deemed their respective heart rate zone. This made the data analysis portion more "fun," if you will. I think that standardizing the time spent in each zone and the heart rate zones themselves as best I could made this process much simpler.
I believe that with the slower mile time, in addition to the warm up and cool down, it made sense as to why the data suggests more time was spent in Zone 1 across all devices. I don't believe that any single device would benefit someone way more than another. They all give valuable information in regard to time spent in a specific zone, it just so happens that their thresholds are different. As I've stated previously, I think the easiest way to determine if you have exceeded Zone 2 is if you fail the talk test, which simply means you cannot hold a conversation at a comfortable level while exercising. If you perform this test and then look at the zone your wearable device determines you are in, this would be a good zone to pick for your next Zone 2 training session.
It is arguable that the Polar chest strap is the most accurate, but I have worn my Whoop 24/7 for the last 3 years. Given this, I'd say this device knows my heart quite well, but there is always more to the picture when it comes to wearable devices. I value the fact that each device was at least similar for 2 of the zones because it gave me the reassurance I need to keep training using these devices. Given this, I may simply focus all of my training by just using one device rather than trying to be in the same zone in all 3 or by looking at general trends as I've done here.
Overall, I thoroughly enjoyed this comparison study as it allowed me to express my interest in the field of technology and health. Despite this study not being as long as my last two, I don't believe that the length of the study would have affected the data I received. This has also given me the opportunity to test my heart health during a 1-mile run, and I am so thankful to be able to move my body for any task required of it. I can't wait to see what is next as it relates to my interest in wearable devices and health technology.
Get a free WHOOP 4.0 and one month free when you join with my link: https://join.whoop.com/A1863B